By Simone bøgelund rasmussen, Malte Herold, randy k. Heath, kristine sundwall & emma ella petersen
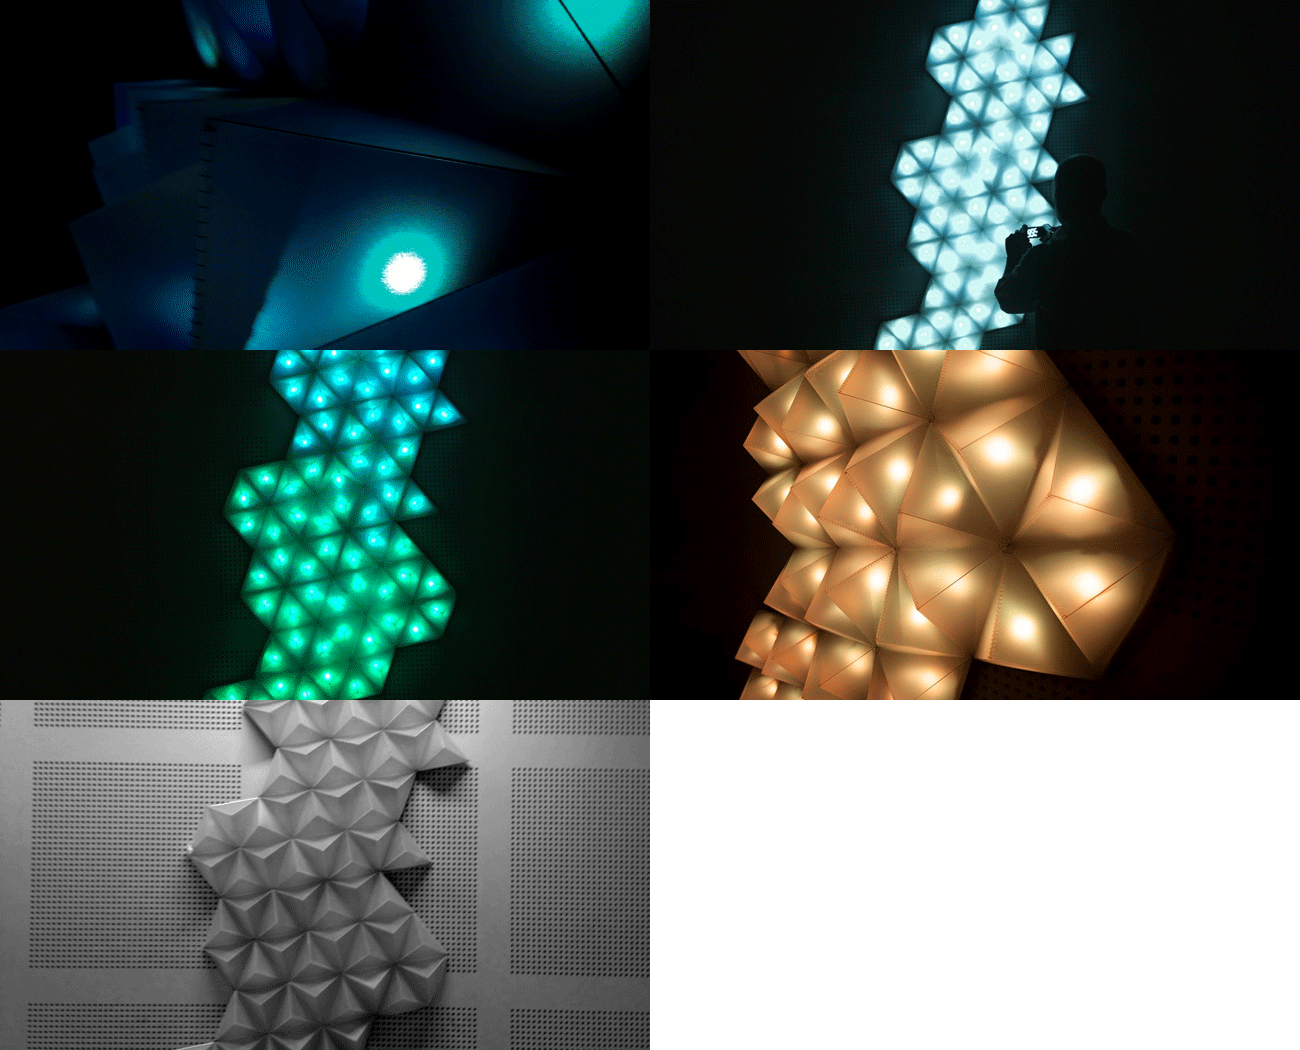
WiDa is a physical interactive art installation visualizing wind data. The data is from DONG Energy, and comes from an offshore submarine station, Lidar, at Anholt wind farm. The Lidar is measuring the wind at ten different heights and the triangle structure is created upon the ten heights from 40m til 290m. The colors visualize the wind speed, and the brightness of the light represents the wind-dispersion. Both will change according to the data. WiDa lights up when the spectator spins the wheel and after spinning for 24 seconds, 24 hours of data have passed by.


